MAT 350 Project Two Guidelines and Rubric
MAT 350 Project Two Template
MAT 350: Applied Linear Algebra
Problem 1
Use the svd() function in MATLAB to compute A1, the rank-1 approximation of A. Clearly state what A1 is, rounded to 4 decimal places. Also, compute the root-mean square error (RMSE) between A and A1
Solution
A1 = 3×3
| 1.3889 |
1.7059 |
1.9807 |
| 3.3118 |
4.0678 |
4.7230 |
| 5.7253 |
7.0322 |
8.1649 |
ans = 1
RMSE = 0.8155
Problem 2
Use the svd() function in MATLAB to compute , the rank-2 approximation of A. Clearly state what is, rounded to 4 decimal places. Also, compute the root-mean square error (RMSE) between A and . Which approximation is better, or ? Explain.
Solution:
A2 = 3×3
1.0100 1.8213 2.1469
2.9907 4.1656 4.8639
6.0029 6.9476 8.0431
ans = 2
RSME2 = 0.2689
Explain:
Problem 3
For the matrix A, the singular value decomposition is where. Use MATLAB to compute the dot product. Also, use MATLAB to compute the cross product and dot product. Clearly state the values for each of these computations. Do these values make sense? Explain.
Solution:
U1 = 3×1
-0.2055
-0.4900
-0.8471
U2 = 3×1
-0.6658
-0.5644
0.4880
U3 = 3×1
-0.7172
0.6643
-0.2103
d1 = -6.9000e-06
c = 3×1
-0.7172
0.6643
-0.2103
d2 = 0.9999
Explain:
Problem 4
Using the matrix , determine whether or not the columns of U span . Explain your approach.
Solution:
U = 3×3
| -0.2055 |
-0.6658 |
-0.7172 |
| -0.4900 |
-0.5644 |
0.6643 |
| -0.8471 |
0.4880 |
-0.2103 |
| reducedU = |
3×3 |
|
| 1 |
0 |
0 |
| 0 |
1 |
0 |
| 0 |
0 |
1 |
ans = 3
Explain:
Problem 5
Use the MATLAB imshow() function to load and display the image A stored in the image.mat file, available in the Project Two Supported Materials area in Brightspace. For the loaded image, derive the value of k that will result in a compression ratio of . For this value of k, construct the rank-k approximation of the image.
Solution:
CR = 2.0000
A801 = 2583×4220
ans = 801
A801
= 2583×4220 uint8 matrix
Explain:
First, we had to load the image in order to determine the M & N values 2583 x 4220.
Then I had to convert this into a matrix uint8 to a double in order to utilize the SVD
Then, I derived the value of k, that made the compression = 2.
Problem 6
Display the image and compute the root mean square error (RMSE) between the approximation and the original image. Make sure to include a copy of the approximate image in your report.
Solution:
RSME801 = 9.5906e-04
Problem 7
Repeat Problems 5 and 6 for , , and . Explain what trends you observe in the image approximation as increases and provide your recommendation for the best based on your observations. Make sure to include a copy of the approximate images in your report.
Solution:
CR = 10.0127
A160 = 2583×4220
| 28.5023 |
28.4627 |
29.3196 |
27.9087 |
28.6184 |
26.5532 |
27.9189 |
25.7023 |
| 26.6380 |
26.7335 |
27.2446 |
25.9346 |
26.6994 |
25.3844 |
27.4323 |
25.3185 |
| 27.7105 |
26.9342 |
27.3695 |
25.8611 |
26.2616 |
24.8003 |
26.8496 |
24.7796 |
| 26.6047 |
26.2936 |
26.6370 |
25.8935 |
26.9915 |
25.8782 |
27.7421 |
25.4926 |
| 25.4761 |
25.3280 |
25.3720 |
24.6828 |
25.3964 |
24.6848 |
26.1862 |
23.9901 |
| 24.0066 |
23.4106 |
23.1904 |
22.8845 |
23.3535 |
22.7318 |
23.9445 |
22.0238 |
ans = 160
A160 = 2583×4220 uint8 matrix
RSME160 = 0.0025
CR = 25.0318
A64 = 2583×4220
ans = 64
A64 = 2583×4220 uint8 matrix
RSME64 = 0.0037
CR = 76.2875
A21 = 2583×4220
A21 = 2583×4220 uint8 matrix
Explain: Displaying the last rank should be the blurriest version of the image thusfar. All I did for this was use a different value for k to get a different compression ratio. Using different compression ratios from the instructions (CR = approx 10, 25, and 75). From the different compression ratios, the quality is reduced drastically with a compression rate of 25 and 75. The best compression rate would have to be 10, followed by 2, 25, and last 75.
I would recommend a compression of 10.
Related; MAT 350 Project One Guidelines and Rubric / MAT 350 Project One Template.
Order This Paper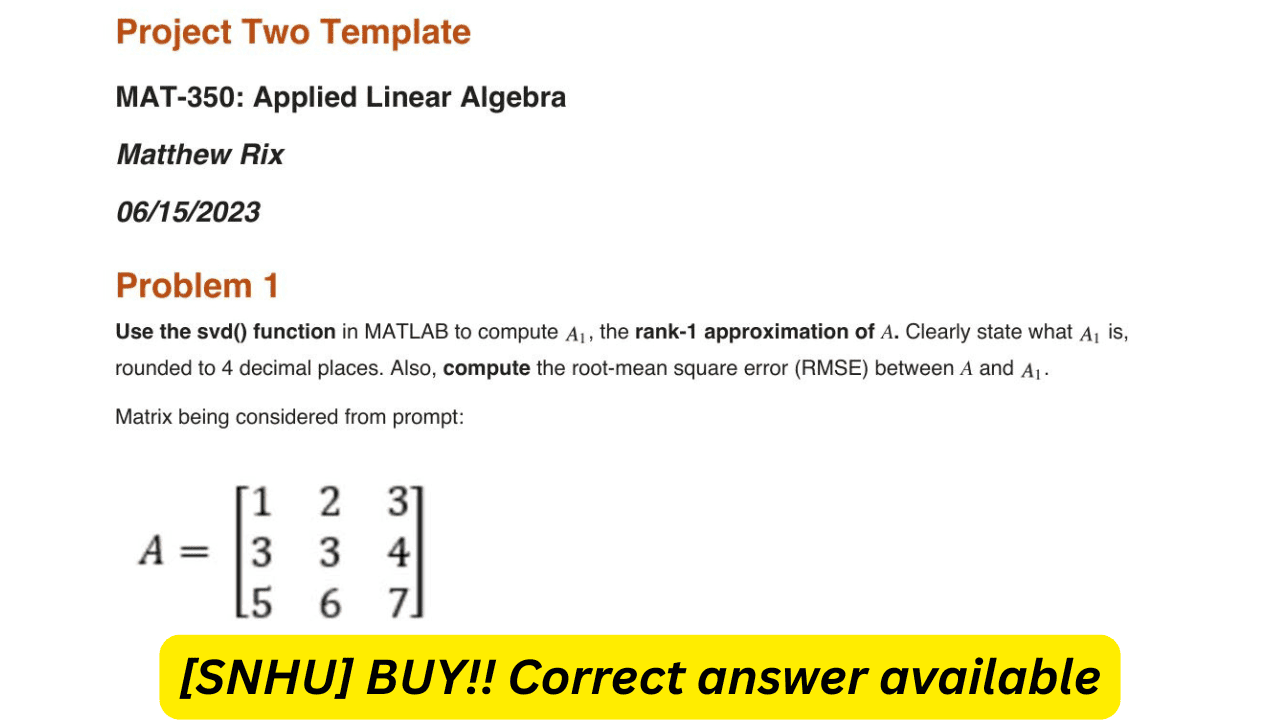


Reviews
There are no reviews yet.